TOPICS IN THIS SECTION
Below is a list of all topics in this section and the website in general. Please click to go to the page of your choice
Breast Cancer is the most common cancer in India, including cities and rural areas. Both Chennai and Bengaluru, have been seeing rising numbers over the years and breast cancer is the most common cancer in these cities as well.
The statistics for Chennai and Bengaluru have been sourced from the Publication of PBCR 2012 - 2014 (PBCR = Population Based Cancer Registry, an arm of NCRP). Unfortunately, any published Indian data after this is not available (or atleast I am not aware). Globocan 2018 cites country wide breast cancer statistics for the year 2018, but does not give city wise breakup. So, for the time being, we stick to PBCR data, and also the personal experiences of many Oncologists treating Breast Cancer in these cities, who do agree with the rising trend in young and increasing numbers.
The charts below were published in the PBCR 2012 - 2014 data. They show, unequivocally, that breast cancer indeed is the most common cancer in Chennai and accounts for almost one third of all cancers in women in Chennai.
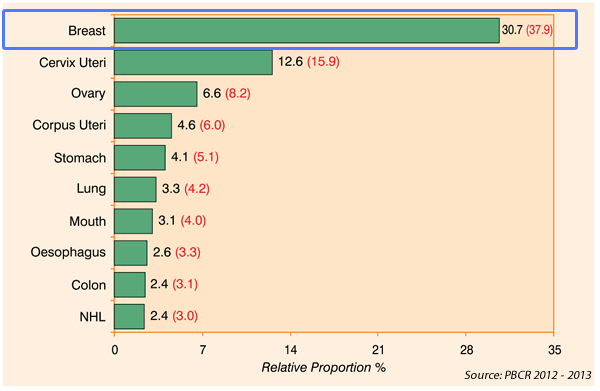
From this chart showing the percentage wise distribution of different cancers in Chennai:
Breast Cancer is the most common cancer in women in Chennai and accounted for 30.7% of all cancer cases in women in Chennai. This almost amounts to one third of all cancers. This means, every third cancer detected in a woman in Chennai will be a breast cancer.
The second most common cancer was cancer of the cervix, which was 12.6% of all cancers in women. You can judge the difference between the first (breast cancer), and the second (cervical cancer), telling us how much the numbers of breast cancer in Chennai are increasing.
The numbers in the registry might be lower than the real incidence, because some breast cancer patients are managed at smaller hospitals and may not be reported at all.
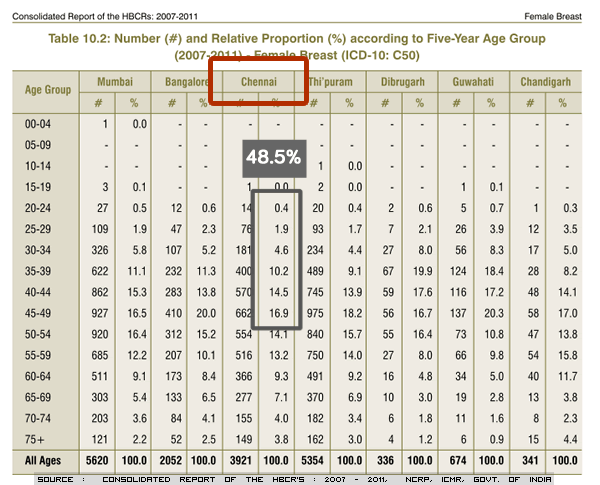
This chart is from the HBCCR (Hospital Based Cancer Registry), and is the only one available (though a bit older), which is showing distribution of breast cancer in women in Chennai according to their age group. We have marked out the percentage distribution for age group of 25 to 49, and it comes to about 48.5% of all breast cancer cases. This tells us about the rising numbers in younger women.
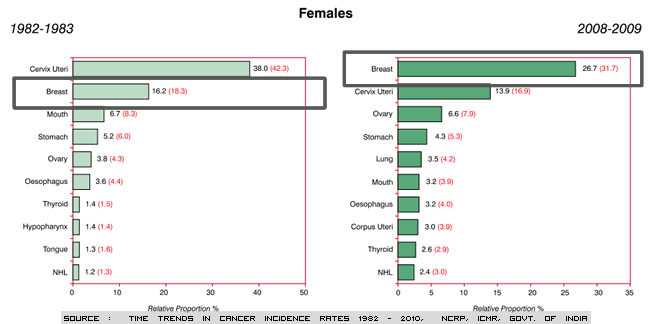
Again, this is an older chart, but one of the few available to show the trends. See both cervical cancer and breast cancer. Breast Cancer has increased over last few decades while cervical cancer has actually reduced. Earleir Cervical cancer was so common and breast cancer was not even half of it. Now, the trends have completely changed.
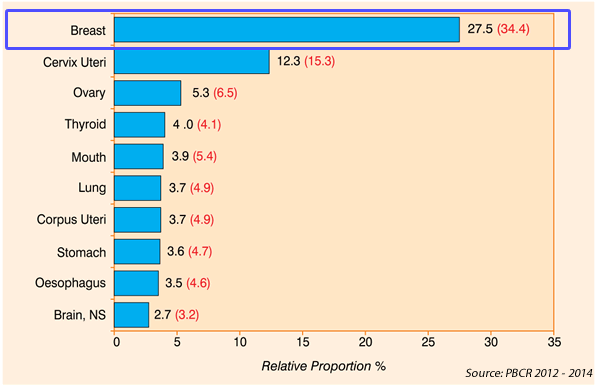
From this chart showing the percentage wise distribution of different cancers in Bengaluru:
Breast Cancer is the most common cancer in women in Bengaluru and accounted for 27.5% of all cancer cases in women in Bengaluru. This almost amounts to almost one fourth of all cancers. This means, every fourth cancer detected in a woman in Bengaluru will be breast cancer.
The second most common cancer was cancer of the cervix, which was 12.3% of all cancers in women. Like in Chennai above, you can yourself judge the difference between the first (breast cancer), and the second (cervical cancer), telling us how much the numbers of breast cancer in Bengaluru are increasing.
The numbers in the registry might be lower than the real incidence, because some breast cancer patients are managed at smaller hospitals, and may not be reported at all.
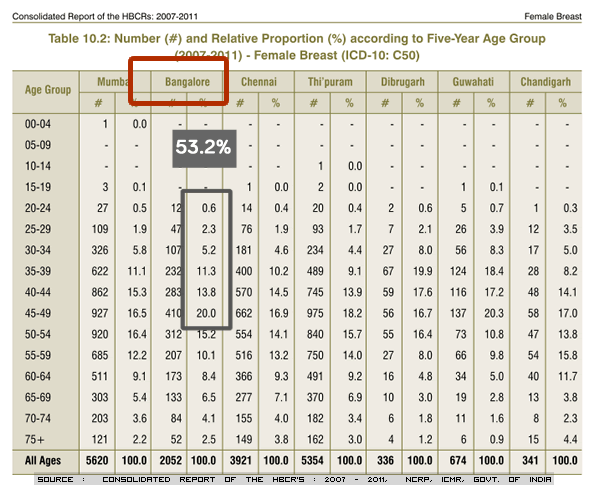
This chart is a little old, for present, but is the only one available, which is showing distribution of breast cancer in women in Bengaluru according to their age group. We have marked out the percentage distribution for age group of 25 to 49, and it comes to about 53.2% of all breast cancer cases. This tells us about the rising numbers in younger women.
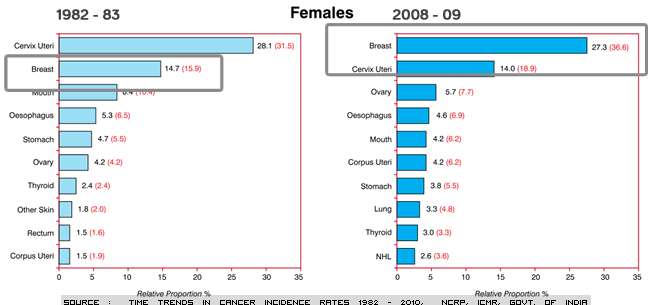
Again, this is an older chart, but one of the few available to show the trends. See the trends of cervical cancer and breast cancer. Initially, cervical cancer was double that of breast cancer, and now its the reverse - breast cancer is double of cervical cancer. Breast Cancer has increased fast over last few decades while cervical cancer has actually reduced.
The message is pretty clear. The numbers of breast cancer (for all age groups) in both Chennai and Bengaluru are rising. We are also seeing more and more numbers of breast cancer in the younger age group (Most cancers in the young tend to be aggressive). The reason is not that few decades back, it was not detected earlier and now it is being detected earlier. The reason is that there has been a very genuine rise in the incidence of breast cancer in younger women.
So the need of the hour is education of the masses - 'Breast Awareness', so that, if they 'know' what happens in breast cancer and what are the symptoms of breast cancer, they can definitely catch it early in case they develop it, they report earlier to appropriate doctors and have a higher chances of a cure or prolonged survival.
Below is a list of all topics in this section and the website in general. Please click to go to the page of your choice